Know what the promise will cost.
Productivity is not proof that AI made the work better
Output per hour can rise while quality, risk, workload and the distribution of gains move in the opposite direction. The productivity paradox is not a reason to dismiss AI; it is a reason to ask what exactly improved, for whom and against what baseline.
What it feels like
The nagging sense of being faster all day and somehow further behind by five o’clock.
You are not anti-productivity. You are asking productivity to identify the work it has moved out of sight.
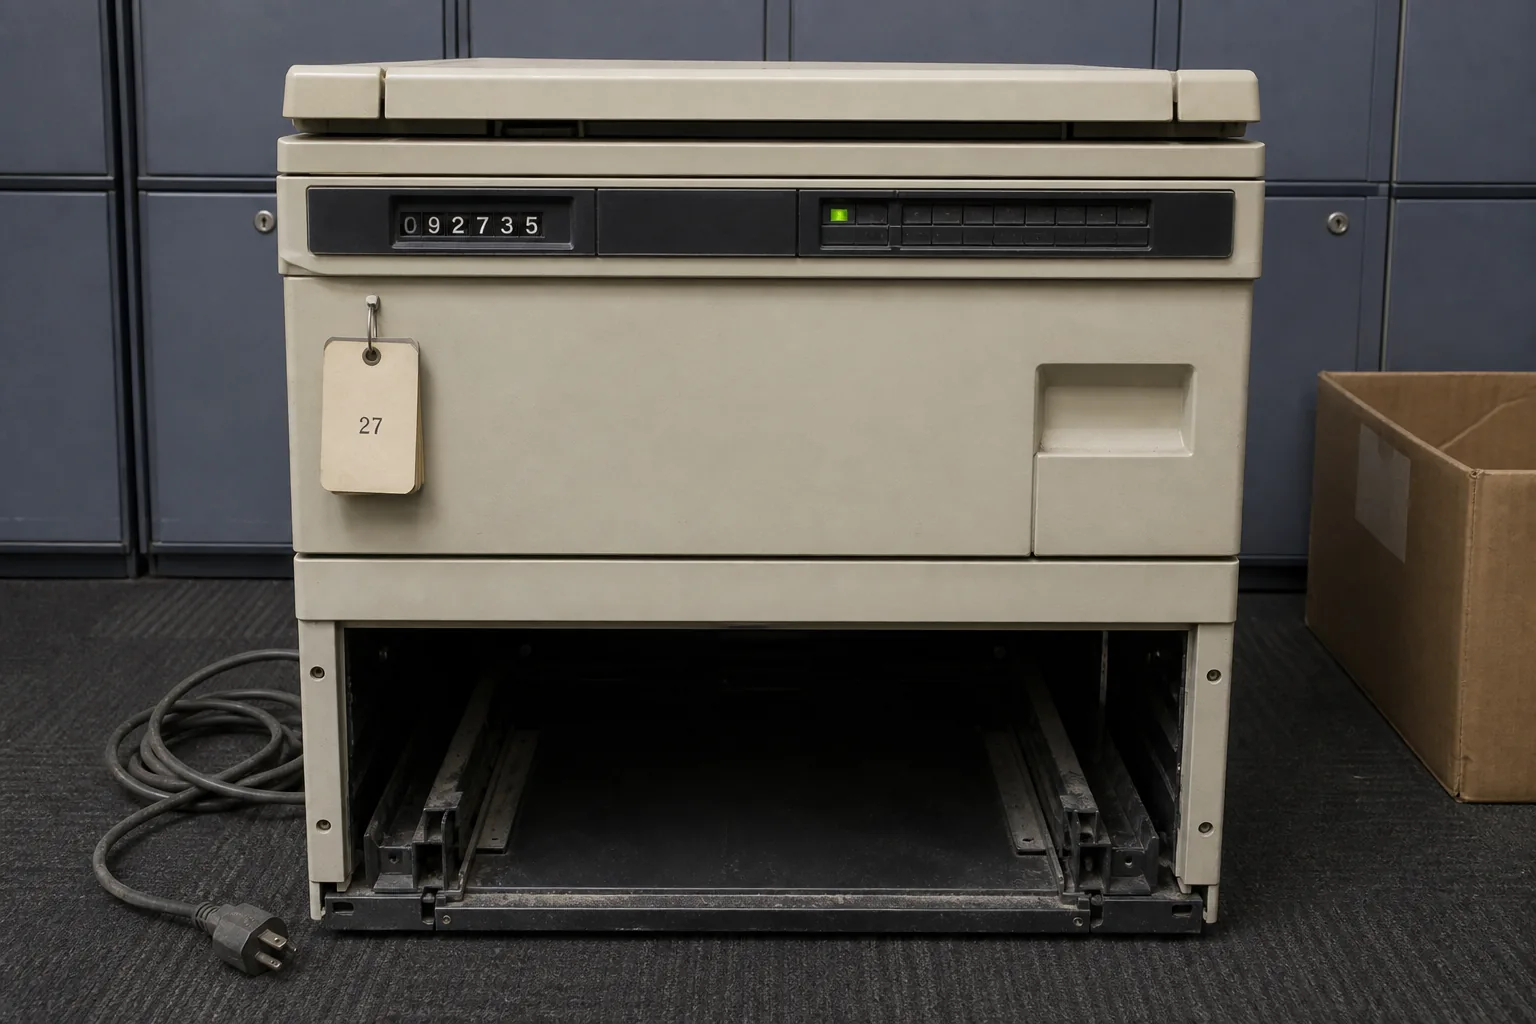
Every small thing got quicker. You are somehow more tired.
Your reply is drafted before the coffee cools. The spreadsheet reconciles before the meeting starts. The dashboard already found the exception you’d once have spent an hour hunting.
By five, your list of things done is longer than it used to be.
So is the list of things waiting for a reply, a check, a decision, a proof that the quick work counted.
You’re not ungrateful for the help.
You’ve got messages, deadlines, a meeting that should have been an email, people who need an answer before they can start their own work.
You’ve got a child to collect, a bill to pay, dinner to make, and no moral obligation to perform every repetitive task slowly enough to demonstrate your worth.
When the assistant saves you time, taking it isn’t laziness. It’s what a person does with a day already overfull.
Nobody needs to warn you about a machine here.
The trouble is a word.
Productivity has become a receipt for work done somewhere, by someone, at some cost.
The receipt is usually real.
It’s just rarely the whole bill.
1997 — The spreadsheet turns your afternoon into an hour.
2010 — The dashboard adds three more reports.
2024 — The assistant drafts them all.
2026 — Your output is up. So is the work of proving it counts.
A number carrying too much
Labour productivity has a plain meaning.
Output compared with labour input.
Usually output per hour.
It’s useful precisely because it asks whether more got produced out of the hours you already had.
It isn’t a score for you, and it isn’t a certificate that a technology made your workplace better.
A call centre can count quality-adjusted resolutions per paid handling hour. A professional-service firm can count completed, reviewed client work per delivery hour.
Either way, name your unit before anybody admires it.
The small arithmetic is honest and still incomplete.
Close 120 cases in 60 of your hours and the observed rate is 2.0 an hour. If you got there by deflecting the difficult cases, inviting errors, or pushing the checking onto customers, that ratio hasn’t found a service gain.
It found a local victory and lost sight of the next queue.
Your completed output, defect or recontact rate, cycle time and hours belong in one view.
That boundary is where your familiar office feeling comes from.
You’re faster at the visible task.
The invisible task grows.
Reading the draft closely enough to own it. Explaining the exception the template refuses.
Repairing the customer record the tool misunderstood.
Showing somebody the answer wasn’t merely plausible.
Your hours didn’t vanish. They moved.
From production to supervision. From writing to checking. From the queue you can see to the queue you can’t.
Output per hour can’t see a hand-off it’s been told sits outside the frame.
None of which is an argument against the number. It’s an argument against asking it to settle questions it was never built to settle.
A purchase can raise your output per hour through capital deepening — more productive services out of hardware, software or digital infrastructure. Or through management, learning, redesign and diffusion, which show up as multifactor productivity.
It can also add review, purchased services and new software inputs.
Labour productivity tells you output per labour hour rose. It doesn’t tell you the whole production system got cheaper.
The public record is deliberately flat about this. In one recent quarter, US manufacturing labour productivity rose while output rose faster and hours rose too.
That’s a real change in output per hour. It won’t tell you whether the cause was utilization, product mix, capital, new technology or better organization.
It certainly can’t identify the application on somebody’s laptop that deserves the credit.
The promise and the denominator
The current pitch is smaller and more persuasive than the old one.
An assistant drafts your routine customer replies from an approved knowledge base. It sounds modest because it is modest. Retrieve material, propose a draft, leave you accountable for sending it.
But your production record has to start before the model is switched on. Weekly request volume, median handling minutes, recontact rate, quality score, escalation rate, cost per completed case.
Without that baseline, “time saved” is an assertion in a confident font.
Then there’s the comparison nobody wants to make when the pilot demos well.
What would your comparable work have looked like without the feature?
A holdout group, a phased deployment, a matched queue, an adjusted trend, a randomized experiment. None of those makes your result less exciting. They tell it what it is.
A before-and-after chart on its own can also be demand, seasonality, a different case mix, new employees, an unrelated management programme, or selection into adoption wearing an AI badge.
One customer-support study gives the difference a shape. Across 5,172 agents at a single large software firm, chats successfully resolved per hour rose about 15% on average.
The earlier working-paper estimate reported 34% for novice and lower-skill workers.
That’s not a disappointment. It’s a mechanism. The system may be carrying practices already held by stronger workers into less experienced work.
But it’s evidence about one defined assisted task. Not an oracle for a company, an occupation or a country.
The history says effects are heterogeneous. Not because technology is magical or cursed.
Because your work arrives with different skills, task mixes, data, managers, demand, and capacity to change.
OECD analysis associates about half the rise in firm productivity dispersion over 2010 to 2015 with digitalization. Its laggards — the bottom 40% of the distribution — converge more slowly in the most digital- and skill-intensive industries.
The frontier improves first. The average doesn’t automatically follow.
And sometimes the average rises for a reason that should make everyone inside it look up.
An industry gets more productive when stronger entrants grow, leading firms take share, or labour and capital move away from weaker firms.
Reallocating output and inputs away from less productive US manufacturing businesses accounted for roughly half of multifactor-productivity growth over one decade.
That isn’t a story where every workplace got wiser. It’s a story about who kept your work.
The ledger behind the demo
Your service has a longer ledger than the model has a price.
Your external consumption: inference, hosted seats, data storage, cloud compute, security tooling, supplier support.
Your internal delivery: product and process-owner time, data engineering, integration, evaluation, security review, legal and procurement work, training, help desk, monitoring, incident response.
And change has its own cost. Redesigning your work. Running old and new in parallel. Auditing output. Absorbing the errors that arrive after the demonstration.
None of that argues for leaving the old work exactly where it is.
It explains the productivity paradox’s four sober possibilities. False hopes. Mismeasurement. Redistribution. Implementation lags.
Complementary innovation is the unglamorous part. Interoperable data, redesigned jobs, performance measures, training, management attention, supplier relationships, and your customer agreeing to any of it.
A product can be available long before your employer has made the surrounding work capable of receiving it.
Usage isn’t the result either.
Eligible cases, drafts shown, accepted-without-material-edit rate, material edits, your overrides, time-to-send. Those sit at different distances from a model invocation.
A high acceptance rate can be trust. It can also be you, rubber-stamping.
In a 2025 McKinsey survey, 88% of respondents reported regular AI use in at least one business function, while 39% reported an enterprise-level EBIT impact.
That isn’t a contradiction. Those are different denominators.
Where did your hour go?
Here’s the question that turns the anxious feeling into an argument.
A drafting service can cut minutes per case. Those minutes become cash only when your employer avoids hiring, cuts overtime or contractor spend, closes a site, or removes a contracted service.
If demand is unconstrained, the same minutes mean more throughput or better service. If staffing is fixed and demand is flat, they mean resilience, or time for work that deserves you.
Each of those is a benefit. None of them is the same benefit.
The survey record makes that restraint look less like pedantry.
Stanford HAI reports cost savings from AI in service operations for 49% of respondents, supply-chain management for 43%, software engineering for 41%. The most common reported saving is under 10%.
Among those reporting revenue gains, 71% in marketing and sales, 63% in supply chain, 57% in service operations. The most common increase is below 5%.
Reported function-level outcomes. Not a promise anybody can paste into your business case.
So your ledger keeps three stories from collapsing into one.
At the bottom, the technical measures. Availability, latency, supported-answer rate, policy violations.
In the middle, adoption and workflow. Eligible use, completion, quality, rework, escalation, cycle time.
At the top, business measures. Cost per completed case, revenue per opportunity, loss rate, retention, service level.
A drop in latency isn’t customer value. A rise in daily prompts isn’t financial return. And an hour counted by two teams is not two hours.
Finance has a role here that’s almost tender in its refusal to be impressed early.
It can ask how your calculation handles sunk costs, allocated platform cost, avoided rather than realized cost, case mix, seasonal demand, training time, new rework, vendor consumption, and capacity nobody can redeploy.
It can report confidence and adverse effects beside the headline.
That isn’t obstruction. It’s how an organisation stops the work of proving the result becoming somebody’s unpaid evening. Probably yours.
You’re not anti-productivity. You’re asking productivity to name the work it moved out of sight.
The assistant may genuinely make your day better. It may turn a routine reply into a fast, accurate answer and leave room for the difficult work that deserved you in the first place.
But speed, quality, capacity and value are not synonyms. Neither are firm gains, workload and bargaining power.
The old spreadsheet turned one afternoon into an hour. The new assistant may turn the next batch of drafts into an hour.
The question has stayed stubbornly human. After the hour is saved, who gets it, who pays for the work around it, and who is allowed to call that better?
Put this to work
- Output per hour measures a defined output against labour input and needs quality, cost, capacity, and boundary measures beside it.
- A credible technology claim needs a pre-change baseline and a counterfactual such as a holdout group, phased deployment, or matched queue.
- Model usage, task speed, quality, released capacity, and financial value are different measures at different distances from a model invocation.
- A lower handling time becomes a cash saving only when spending changes, such as avoided hiring, reduced overtime or contractors, a closed site, or a removed contracted service.
- The AI cost stack includes external consumption, internal delivery, and the change cost of redesign, parallel running, review, and error absorption.
- Technology gains vary across workers and firms, while sector gains can reflect diffusion, reallocation, or changed market shares rather than uniform improvement.
Questions
- What does output per hour actually prove?
- Output per hour proves only that a defined amount of output is produced with a stated amount of labour input. It can show a change in the efficiency of a bounded task or service, but it does not alone prove better quality, lower total cost, customer value, wage gains, or a technology effect. Those claims require matched quality, cost, capacity, and comparison evidence.
- Why can a team look more productive while the service gets worse?
- A team can close more cases per hour by deflecting difficult cases, increasing errors, shifting checking to customers, or moving work to an unmeasured queue. A service measure therefore needs completed output, defect or recontact rate, cycle time, and labour hours together. The production boundary also includes necessary supervision, technology support, rework, and hand-offs.
- What makes an AI productivity claim credible?
- A credible AI productivity claim defines the eligible task, actual hours, quality threshold, adoption status, and measurement period before rollout. It compares treated work with a credible untreated alternative, such as a holdout group, phased deployment, matched queue, adjusted before-and-after trend, or randomized experiment. A company testimonial after adoption cannot by itself separate the model effect from demand, seasonality, case mix, or another process change.
- Does a higher prompt count show that an AI service creates value?
- No. Prompt count and feature opening are usage measures, not proof of workflow or financial value. A production service distinguishes eligible cases, drafts shown, accepted-without-material-edit rate, material-edit rate, overrides, and time-to-send, then compares quality and customer outcome. A high acceptance rate can mean trust or passive rubber-stamping, so it needs sampled accuracy and downstream evidence beside it.
- When does saved time become a real cash saving?
- Saved time becomes a cash saving only when spending changes. It can support avoided hiring, lower overtime or contractor spend, a closed site, or removal of a contracted service. With fixed staffing and flat demand, lower handling time may instead improve throughput, service, resiliency, or time for higher-value work. Those benefits can be real without being booked as the same financial outcome.
- What costs belong beside the claimed benefit of an AI service?
- An AI service cost includes model inference, application seats, storage, cloud compute, security tooling, and supplier support. It also includes product and process-owner time, data engineering, integration, evaluation, security review, legal and procurement work, training, help desk, monitoring, and incident response. Redesign, parallel running, output review, and error absorption are change costs even when no separate invoice arrives.
- Why is a cheap model call not the same as a cheap AI service?
- A model-call price is only one external consumption unit. A service also needs governed data, identity, retrieval, evaluation, workflow integration, controls, support, and a recurring operating owner. GPT-3.5-equivalent query pricing fell from US$20 per million tokens in November 2022 to US$0.07 per million tokens in October 2024, but falling inference prices do not remove integration and operating costs.
- Can one successful AI pilot prove that the company got more productive?
- No. A local result applies to its task, workers, tool, setting, and outcome. In one customer-support study of 5,172 agents at a Fortune 500 software firm, an assistant increased successfully resolved chats per hour by 15% on average. That result does not establish a firm-wide or economy-wide effect, and earlier evidence found larger gains for novice and lower-skill workers than for experienced workers.
- Why do some workers or firms gain more from the same technology?
- Technology effects vary with initial skill, task mix, data quality, managerial capability, product demand, and the way a tool is introduced. Assistance can diffuse practices embodied in stronger workers, while firms also need complementary skills, organizational capital, and redesign. Digitalization is associated with about half of the rise in firm productivity dispersion over 2010–15, which shows unequal realization rather than a uniform dividend.
- Why can an industry get more productive without every firm improving?
- Industry productivity can rise when higher-productivity entrants grow, leading firms gain market share, or labour and capital move away from weaker producers. OECD work defines laggards as the bottom 40% of the productivity distribution and finds slower convergence in highly digital- and skill-intensive industries. Aggregate improvement therefore can reflect diffusion and reallocation as well as within-firm technical improvement.
- Why do AI pilots often fail to become lasting services?
- An AI pilot becomes a maintained service only when it has an owner, operating budget, current permissioned sources, evaluation, support, and a defined workflow outcome. Gartner reported that 41% of generative-AI prototypes and 42% of non-generative prototypes reached production on average in its 2024 enterprise survey. Stopping a pilot can be a useful decision when it exposes missing data, an unworkable rule, or insufficient benefit before a broad release.
- Why can lots of AI use coexist with little financial return?
- Usage, workflow performance, and enterprise return are different measurements. In a 2025 McKinsey survey, 88% of respondents reported regular AI use in at least one business function, while 39% reported an enterprise-level EBIT impact. A finance review adjusts for case mix, seasonal demand, training time, new rework, vendor consumption, and capacity that cannot be redeployed before it calls a benefit financial value.